
AI leaders extract 2.3x more value per employee than laggards. That gap, measured across a benchmark of 255 enterprise leaders, equals approximately 633 FTE-years of value annually. Contrary to initial observations, it’s not a marginal difference driven by better models or larger budgets. It’s a structural divide in how organizations convert AI capability into business outcomes.
The ROI distribution makes the divide visible. Across the benchmark:
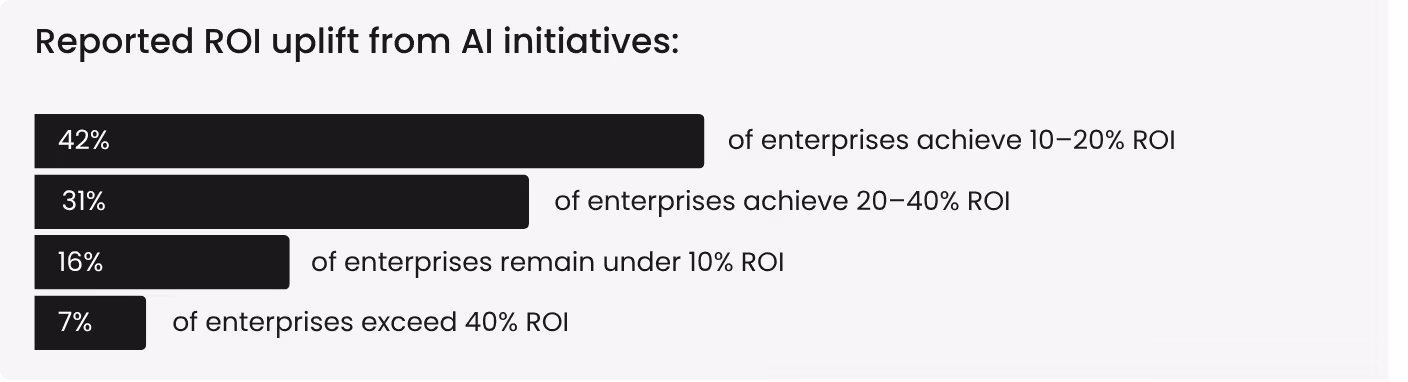
The top performers are not experimenting with different AI. They’re operating AI differently with higher automation, tighter integration, better measurement, and deliberate governance that compounds returns rather than letting them dissipate.
Seven measurable traits define what that operating model looks like. Each one is drawn from the benchmark data and reflects what separates enterprise-grade AI programs that deliver scalable AI solutions from the majority that plateau after early wins. We’ll take a look at each over the next few paragraphs.
Trait 1: 40%+ workflow automation
AI value rises materially once workflow automation exceeds approximately 40%. Below that threshold, organizations are primarily in assistance mode. Basically copilots and recommendation engines that make people faster without changing the cost structure of how work gets done.
The truth is, speed becomes a structural advantage only when AI removes handoffs, rework loops, and manual intervention from the process itself. And the proof is reflected by the top 7% averaging approximately 63% workflow automation.
They’ve crossed from AI that accelerates tasks to AI that executes workflow steps. The report frames this directly. Cost savings consistently appear where AI reshapes how work flows, not just how work is performed. Reaching this threshold requires targeting the interpretive workflows where human review creates latency without adding proportional value.
Trait 2: 50%+ value conversion
The benchmark measures what percentage of AI-generated time savings actually converts into measurable business value. The distribution is revealing. Only 5.1% of enterprises convert 75% or more. Another 46.3% convert between 50 and 75%. And 43.5% sit in the 25 to 50% range. The self-reported average is roughly 50%, with the aggregate overview estimate closer to 41%.
The top 7% convert at approximately 71%, producing about 4.25 measurable value hours per employee per week. Laggards convert at 30% or below, yielding roughly 1.82 hours. That 2.3x gap is the difference between deliberate capacity reinvestment and unstructured time savings where reclaimed hours disappear into meetings, email, and untracked work expansion. This is the value leakage pattern that defines most enterprise AI programs.
Conversion rate is not a function of AI capability. It’s a function of whether the organization has defined where saved time goes. This is the single most actionable finding in the enterprise AI ROI data. Programs that specify reinvestment targets per function, per team, and per workflow consistently convert at higher rates than those that measure time saved without measuring what the saved time produces.
Trait 3: Closed-loop execution
The defining structural trait of high-ROI programs is closed-loop execution. Which essentially is where AI output flows into a system action, which produces a measurable change in a business metric. Revenue per customer, processing cost per transaction, compliance cycle time, escalation volume. The metric moves because the loop is closed.
The benchmark draws the distinction clearly. Dashboards and copilots increase activity. Closed-loop execution, where AI output connects to system action connects to metric impact, is what converts activity into enterprise outcomes. This is what separates production-ready AI from AI that generates impressive outputs without moving a business number.
High-ROI enterprises architect this loop deliberately. AI does not produce a recommendation that a human reviews and manually enters into another system. It triggers the next workflow step directly, with human governance on exceptions rather than every transaction. The handoff friction has been engineered out of the process. This is where agents and automation move from experimental to structural.
Trait 4: Quality instrumentation
Quality improvement is the strongest predictor of executive satisfaction with AI initiatives. That correlation is stronger than error reduction, throughput increase, workflow automation, and even adoption levels. Yet quality remains one of the most under-instrumented dimensions of enterprise AI programs.
The benchmark quantifies the gap. The average quality improvement score across the survey is 7.6 out of 10. Only 56.9% of enterprises rate their quality improvement at 8 or above. Organizations are getting real quality gains from AI, but most are not measuring them rigorously enough to demonstrate the impact to leadership.
This matters because of what executives actually value. Payback speed shows little relationship to satisfaction. Executives value trust, consistency, and reliability more than rapid wins. Enterprise-grade AI programs treat quality as a first-class metric, not as a secondary benefit assumed to follow from productivity gains.
Trait 5: Portfolio governance
High-ROI programs don’t manage AI as a collection of independent projects. They manage it as a portfolio with standardized intake, shared infrastructure, and unified evaluation. The benchmark describes what portfolio governance looks like in practice.
A standardized use-case intake pipeline that evaluates data readiness, risk tiering, and expected unit economics before any deployment begins. Reusable components across the portfolio. And a framework that organizes the tool stack by capability layer, separating foundation models from orchestration from evaluation from governance, so that each layer can be optimized independently.
The alternative is what the benchmark describes among laggards, where each use case is built independently, each with its own data pipeline, its own governance process, and its own evaluation criteria. The result is duplicated effort, inconsistent standards, and integration complexity that grows faster than capability.
Portfolio governance is the structural discipline that prevents AI programs from accumulating technical debt as they scale. It is also what enables the speed that separates leaders from the rest of the field: when the next use case can reuse existing connectors, evaluation frameworks, and governance scaffolding, time to production drops from months to weeks.
Trait 6: Tool consolidation discipline
58% of enterprises run six or more AI tools and platforms. Tool sprawl reduces effective ROI by approximately 20 to 30%. These two findings from the benchmark are directly connected: as use case count grows, tool count tends to grow in parallel, and each additional tool adds governance overhead, integration complexity, and fragmented user experiences that suppress the value the underlying AI could otherwise deliver.
The top performers show a different pattern. Enterprises that consolidate AI tools early, building multiple use cases on shared platform infrastructure rather than adding a new tool for each application, report executive satisfaction scores of 9 to 10. Consolidation does not mean fewer capabilities. It means fewer integration surfaces, fewer governance layers, and faster time to production for each subsequent use case.
The practical application is architectural. A modular AI platform where use cases share data connectors, orchestration layers, and governance controls avoids the sprawl tax that fragmented portfolios accumulate. This is the core argument for evaluating whether your AI tool stack is an asset or a liability, and why the platform decision carries more strategic weight than any individual tool selection.
Trait 7: Reinvestment of reclaimed capacity
The final trait closes the value loop. High-ROI programs do not measure time saved. They measure what the saved time produces. When AI reclaims two hours per employee per day, that capacity can go in two directions. It can dissipate into unstructured work expansion. Or it can be deliberately reinvested into defined outcomes: more deals processed, faster compliance cycles, higher throughput per analyst, reduced escalation volumes.
The benchmark shows that the second path is rare but decisive. Organizations that define capacity reinvestment targets per deployment consistently convert at higher rates and report higher executive satisfaction. The mechanism is simple. If nobody defines where saved time goes, it goes everywhere. If reinvestment targets are explicit, the organization can measure the return on AI at the level of business outcomes rather than hours.
The enterprise AI value flywheel
These seven traits don’t operate independently. The benchmark identifies a specific flywheel that connects them. Adoption leads to automation, which drives throughput, which enables cost reduction, which supports error reduction, which improves quality, which builds satisfaction. Each link strengthens the next. Break any link, and ROI collapses. Strengthen each link, and returns compound.
The path from the median to the top 7% isn’t about doing more AI. It is about building the execution infrastructure that turns AI capability into measurable business results.
Benchmark your AI program against the top 7%. See the full leaders vs laggards analysis, correlation data, and action framework in the Enterprise AI ROI: 2026 Benchmarks report.


.svg)